For more information read Ben’s non-technical PhD summary.
March 2016
My research is involved with measuring how much more carbon is potentially being stored due to saltmarsh restoration and how this can generate funding as a climate change mitigation service; providing a subsidy to restoration and conservation efforts.
My research requires data collection in a broad range of areas, such as ecology, mud, plants, economics….and recently lasers!
To estimate the extra carbon being stored in an area, accurate measurements of that area are needed, such as the height of the sediment or how tall the plants are. I was lucky enough to get the loan of some equipment from NERC, a Terrestrial Laser Scanner, which will hopefully provide just such data. In March 2016 the first deployment of this took place and I spent a few days laser scanning my saltmarsh study sites in the Eden Estuary to produce 3D maps of the entire area.
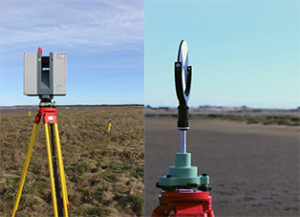
The process is not the fastest and requires many hours out on the estuary to gather all the data, but we were lucky to have relatively nice, warm weather. The basic idea is that the laser scanner (Figure 1) turns itself around in the tripod sending millions of laser beams out and recording them as they bounce back when they hit something, such as a blade of grass or mud. This makes a big ‘cloud’ of points that show the landscape. The downside is that just like your eyes it can’t see around corners or see behind objects, this means many scans have to be made all along the shore the get all the angles.
But eventually I was able to produce this……
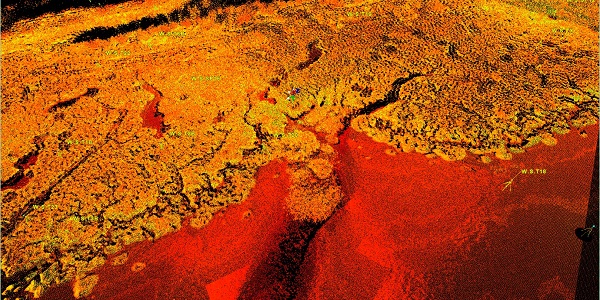
This data will hopefully provide broad scale information of the way in which elevation changes throughout the site and specifically within the areas that have been restored. This information will be used along with carbon content data of sediment to better estimate the extra carbon stored in the mud.
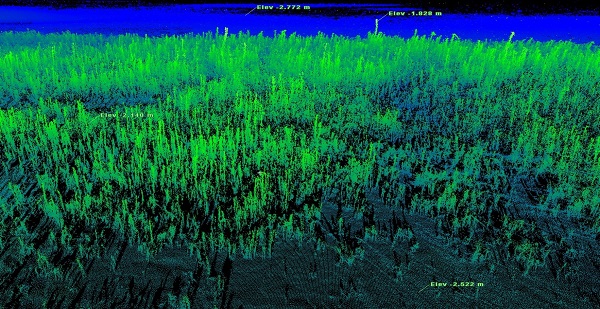
It can also be used to measure the heights of all the plants across the site, showing individual stems of vegetation. With this information and data on how much carbon is stored in vegetation, an estimate of total amount of extra carbon being stored in plants can be made.
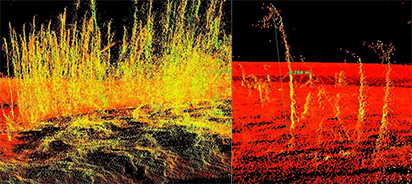
All of this data will feed into my research and provides a valuable insight into the typically subtle but potentially influential changes that occur in carbon storage due to saltmarsh restoration efforts. Furthermore it gives a whole new insight into estuary and it is great being able to explore the 3D world that it creates!
January 2015
I arrived in St Andrews in October 2014, some respects it feels like an age and in others it as if it was only last week. The past handful of weeks has involved attending courses, going to workshops, project planning, networking and reading.
My project will look at the potential use of Blue Carbon (Payments for Ecosystem Services – PES) in subsidising the restoration of threatened and important coastal saltmarsh ecosystems.
Currently, loss of saltmarsh area is estimated to be between 1 and 2 % a year, mainly due to land-use change. In the future this figure could easily increase, as climate change driven sea level rise alters the balance of tidal inundation in the saltmarsh.
However all is not lost!
Increasingly their importance is noted and more attention is being given to their restoration. As carbon emission rise, these slivers of coast between land and sea could offer some degree of mitigation by sequestering and storing carbon away from the atmosphere. I will look in detail at the situation of restoring saltmarshes in Scotland and assess their value in terms of carbon sequestration and subsequently the extent that PES can subsidise these initiatives.
I recently gave a talk to some students of St Leonards School on idea of Natural Capital and the importance of valuing ecosystem services.Engagement like this introduces the issues first hand to the next generation who will play an important role in the future of the environment. Hopefully it is engagement such as this which sets ‘wheels in motion’ for some and encourages them to be part of the change towards a more sustainable future; where the importance of the environment is not so overlooked and the services is provided are fairly valued.