Ecological resilience in hydrological systems: interactions of biological and physical processes on patterns of saltmarsh accretion and erosion.
 There is abundant interest in ecosystem regime shifts and resilience to change, particularly given emergent climate change. Mechanistic understanding of what drives regime shifts and resilience is required, especially for systems that deliver important ecosystem services such as erosion protection. This dissertation will study the patterns and drivers of saltmarsh erosion and accretion, and the biological and physical mechanisms that affect saltmarsh resilience. Marshes can undergo rapid change in area cover and distribution. There are indications, but little empirical data, that some of these changes are natural and cyclical. Potentially, marshes might be changing in area-extent on relatively local scales while retaining a relatively constant cover on larger scales, which would imply larger scale resilience.
Aims and objectives
To examine the patterns of change at different scales within UK estuarine saltmarsh ecosystems, and to understand the environmental and biotic mechanisms that cause those changes.
Research objectives include:
- Analysis of aerial photographs from 1940’s to present day to measure change in tidal channel position, saltmarsh extent and creek network for each time series of estuaries across the UK.
- Gather data on key variables that may influence saltmarsh erosion within the estuaries under examination, and use time correlation to validate their influence against change in marsh extent.
- Assess the influence of failed bank debris on the stability of saltmarsh creek networks by resisting bank erosion, promoting vegetation recovery and adapting to loss of resistance by accreting sediment on an opposite bank.
- Identify whether threshold levels of sediment elevation within Laugharne estuary tidal flats (south Wales) trigger rapid saltmarsh collapse.
Sample Methods
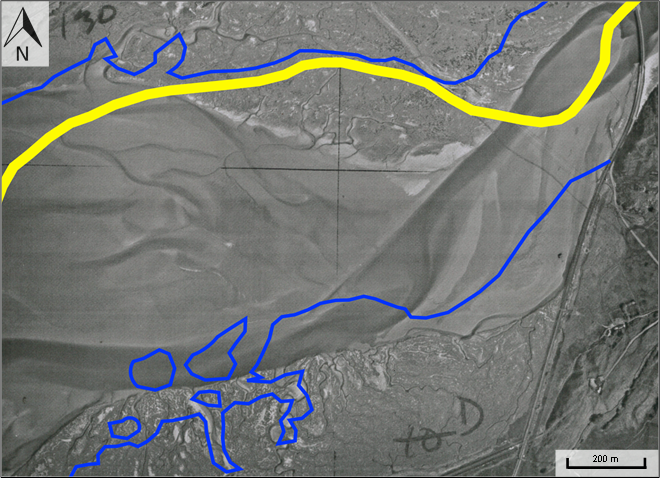
For large-scale patterns of saltmarsh change, historical and modern aerial imagery is being collected for a number of estuaries across the UK. Collections exist in national archives, commercial bodies and local county archives. In each year for a set of images, the salt marsh extent and tidal channel positions are mapped. Comparison between time series indicates where/by how much salt marshes have changed (Figure 1).
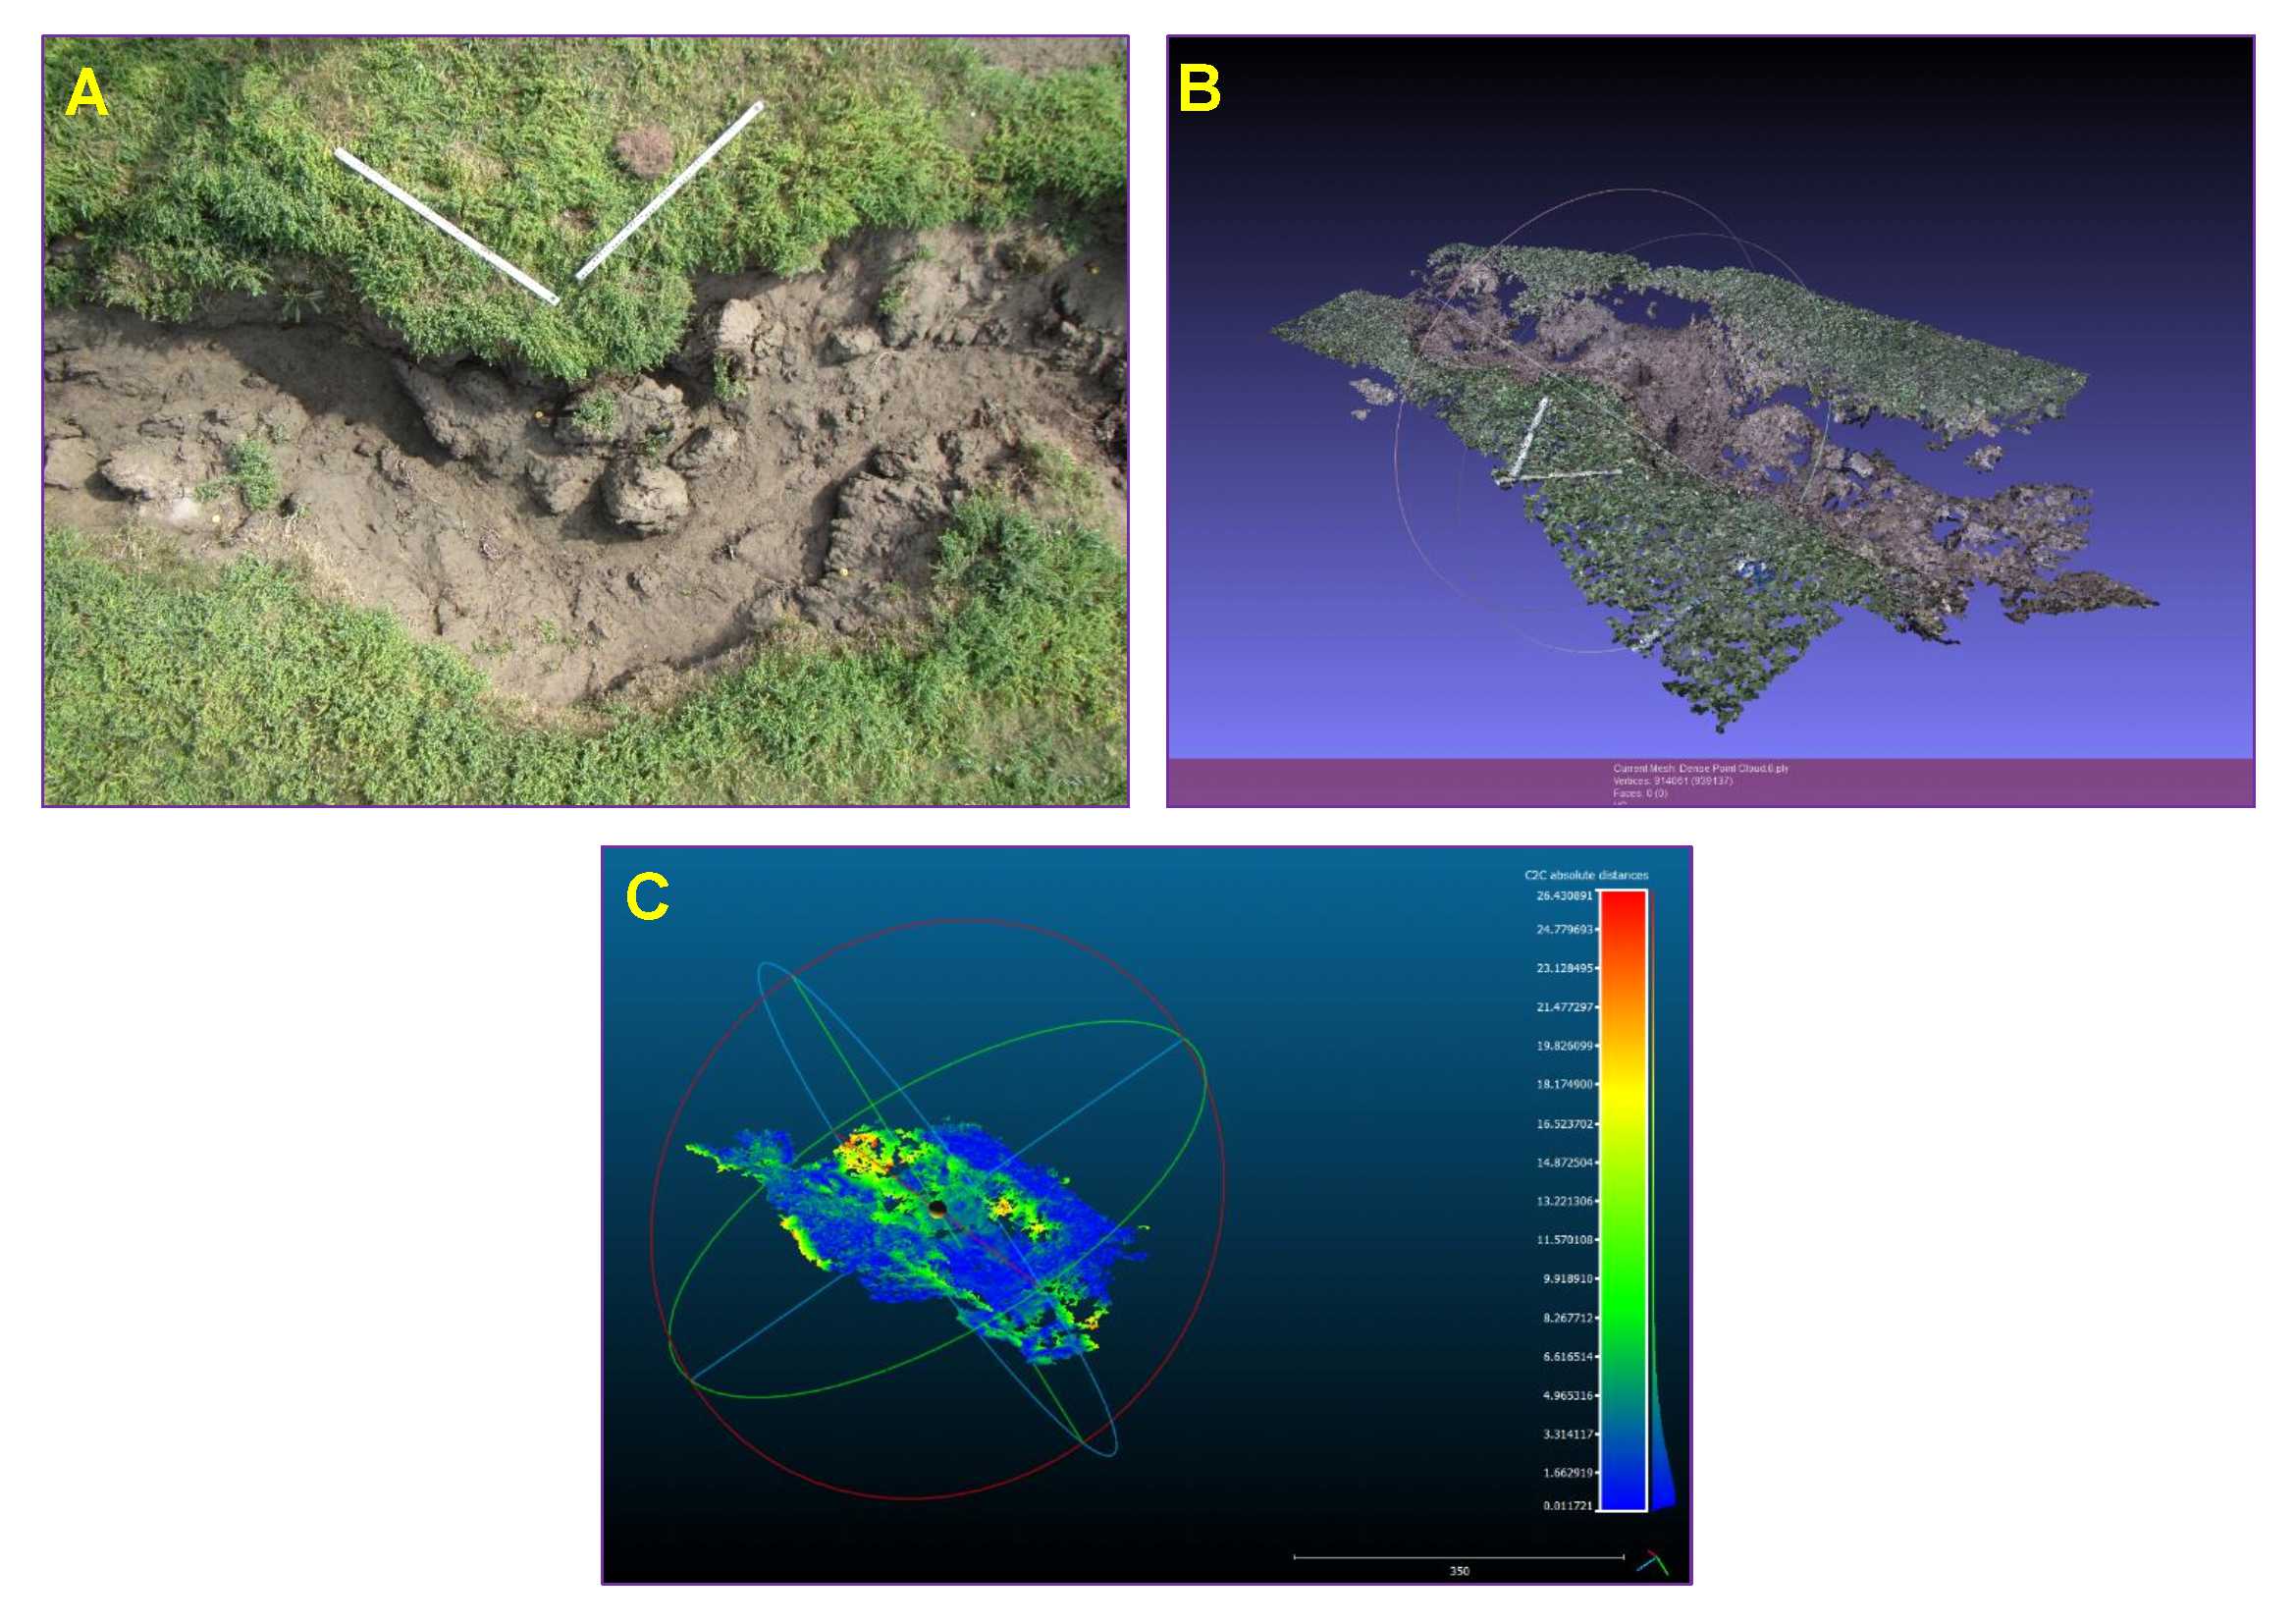
For small-scale changes in creek bank stability, 3D models are being created using a technique called photogrammetry. A camera mounted on a pole and programmed to repeatedly take pictures. The pole is held above a creek to generate a number of overlapping, vertical images. “Tie-points” in each image are identified and the displacement of those points for each image (due to parallax) gives the image depth, allowing computer software to generate 3D models in a process known as ‘Surface from Motion’. Changes in the models over time are observed using ‘CloudCompare’ software, to assess the degree of deviance in creeks over time (Figure 2).